Commentary - June 2023Marketfield L/S Fund
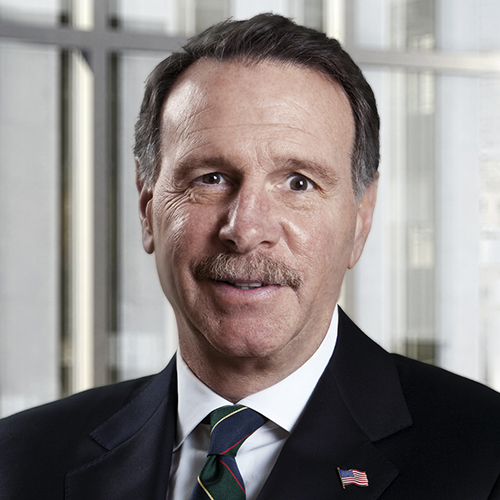
In the commentary below, Portfolio Managers Michael Aronstein and Michael Shaoul, Ph.D. discuss the market over the first half of 2023, how the Fund is currently positioned and how the Fund’s risk profile compares to the overall market.
Would you please discuss your view of the market’s strong first half in 2023?
In 2023, investors saw significantly different market conditions compared to that of 2022. In the first half of 2023, the performance of the S&P 500 Index was driven by a small number of large-cap issues, primarily technology companies. Since the Fund lacks these technology positions, most of our long-sided portfolio did not participate in this market rally.
However, we anticipated many of the economic and policy developments that took place in the first half of 2023. We have challenged the idea that the U.S. would experience a recession, or that the global economy was decelerating.
Given this position, the Fund maintains its procyclical bias. We expect to see another strong period of commodity performance in the second half of the year, driven by a U.S. economy that may perform more strongly than expected and a Chinese economy that could avoid the deterioration being priced in financial markets. Most importantly, valuations in both the energy and material sectors remain at historically low levels, reflecting the conservatism of both management guidance and investor positioning.
We have gradually increased the Fund’s gross long and net exposure over the last few weeks, adding mostly non-U.S. equities in Korea, Japan, and Europe. Valuations abroad look attractive, and these areas could benefit from a weakening U.S. Dollar. In the U.S., we added a healthcare technology issue and a refiner, the latter helping broaden out our energy exposure to include corporate and consumer demand.
Following the banking crisis in the first half of 2023, what is your view on Financials?
There has been little financial stress over the past few months since the collapse of Signature Bank and Silicon Valley Bank, yet the Fund’s largest short position continues to be in select positions in the Financials sector. We remain skeptical about the private equity area of the market given the higher interest rate level following the Federal Reserve’s aggressive hikes.
As of 6/30/23, the Fund had a net short position in the Financials sector of 18%.
How does the Fund’s risk profile compare to the S&P 500?
With the Fund’s long/short strategy, we have the flexibility to hold long positions in companies that may benefit from current macro economic trends. Alternatively, we hold short positions where fundamentals are deteriorating or to reduce overall portfolio volatility.
As a result, over short- and long-term periods, investors have benefited from lower overall risk, as measured by standard deviation, compared to the S&P 500 Index as measured by standard deviation. As shown below, the Fund provided at least 25% less risk than the S&P 500 Index in the 1-, 3-, 5- and 10-year periods ended 6/30/23.
Lower Standard Deviation Than the Overall Market
| 1 Yr | 3 Yr | 5 Yr | 10 Yr | |
|---|---|---|---|---|
| Fund (Institutional Class) | 11.54 | 11.99 | 13.62 | 10.91 |
| S&P 500 Index | 20.58 | 18.19 | 18.79 | 14.93 |
| % Difference | 44% | 34% | 28% | 27% |
Source: Morningstar. Standard deviation is a statistical measure of historical volatility. The S&P 500 Index is a capitalization-weighted index of 500 stocks. An investment cannot be made directly into an index.
